Data Visualization Tools vs. Programming Languages: Which Delivers Better Insights?


Introduction
In the ever-evolving landscape of data analysis and information presentation, the debate between data visualization tools and programming languages has been a long-standing one. Both approaches offer unique advantages and challenges, catering to the diverse needs of professionals, researchers, and decision-makers. As the demand for insightful data-driven decision-making continues to grow, it becomes increasingly crucial to understand the strengths and limitations of these two approaches, and to determine which one delivers better insights.
This article aims to provide a comprehensive comparison of data visualization tools and programming languages, exploring their respective capabilities, ease of use, flexibility, and the quality of insights they can generate. By delving into the nuances of each approach, we will help readers navigate the complexities of data analysis and visualization, empowering them to make informed choices about the tools and techniques that best suit their specific needs.
Overview of Subjects
Data Visualization Tools: Data visualization tools are software applications designed to transform raw data into visually appealing and informative graphics. These tools often offer a user-friendly interface, allowing users to create charts, graphs, and other visualizations with minimal programming knowledge. Popular data visualization tools include Tableau, Power BI, Plotly, and Matplotlib, among others.
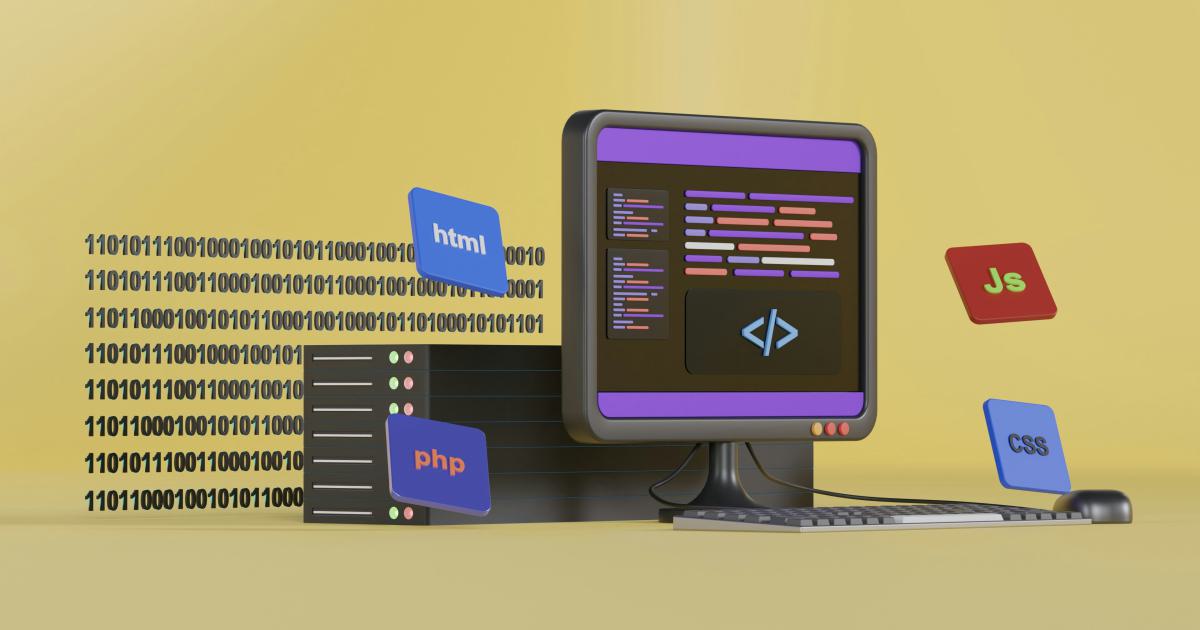
Programming Languages: Programming languages, on the other hand, are text-based tools used to write code and develop software applications. In the context of data analysis and visualization, programming languages like Python, R, and JavaScript provide a more customizable and flexible approach, allowing users to create highly tailored visualizations and perform complex data manipulations. These languages often require a deeper understanding of programming concepts but offer greater control and versatility.
Comparison Criteria
To conduct a comprehensive analysis of data visualization tools and programming languages, we will examine the following key criteria:
Criterion 1: Ease of Use
Data Visualization Tools
Data visualization tools are generally known for their user-friendly interfaces and intuitive design. Many of these tools feature drag-and-drop functionality, allowing users to quickly create and customize visualizations without the need for extensive coding knowledge. This makes them accessible to a wide range of users, from business analysts to marketing professionals, who may not have a strong background in programming.

Programming Languages
Programming languages, on the other hand, typically require a steeper learning curve. Users must possess a certain level of programming expertise to effectively utilize these tools, as they involve writing code, understanding syntax, and working with data structures. However, once users become proficient in a programming language, they can unlock a higher degree of customization and control over their data visualizations.
Criterion 2: Flexibility and Customization
Data Visualization Tools
Data visualization tools often provide a wide range of pre-built chart and graph templates, allowing users to quickly generate visualizations that meet their needs. These tools also typically offer a range of formatting and styling options, enabling users to customize the appearance of their visualizations to align with their brand guidelines or personal preferences.
Programming Languages
Programming languages offer a higher level of flexibility and customization compared to data visualization tools. By writing code, users can create unique and highly tailored visualizations that are not limited by pre-defined templates or built-in functionalities. This level of customization can be particularly beneficial for complex data analysis, where the user may require specific visualizations to effectively communicate their findings.

Criterion 3: Data Handling and Transformation
Data Visualization Tools
Many data visualization tools come with built-in data handling and transformation capabilities, allowing users to clean, filter, and manipulate data within the application. This can be a valuable feature for users who may not have extensive experience in data wrangling or programming.
Programming Languages
Programming languages offer a more comprehensive and powerful approach to data handling and transformation. By writing code, users can perform complex data operations, such as merging multiple datasets, handling missing values, and applying advanced statistical analyses. This level of control and flexibility can be crucial for users who need to work with large or complex datasets.

Criterion 4: Analytical Capabilities
Data Visualization Tools
Data visualization tools often include a range of analytical features, such as trend analysis, forecasting, and interactive dashboards. These tools can be particularly useful for users who need to quickly identify patterns, trends, and insights within their data.

Programming Languages
Programming languages offer a more comprehensive and flexible approach to data analysis, allowing users to apply advanced statistical techniques, machine learning algorithms, and custom analytical models. This level of analytical depth can be essential for researchers, data scientists, and professionals who require in-depth insights and predictive capabilities.

Criterion 5: Collaboration and Sharing
Data Visualization Tools
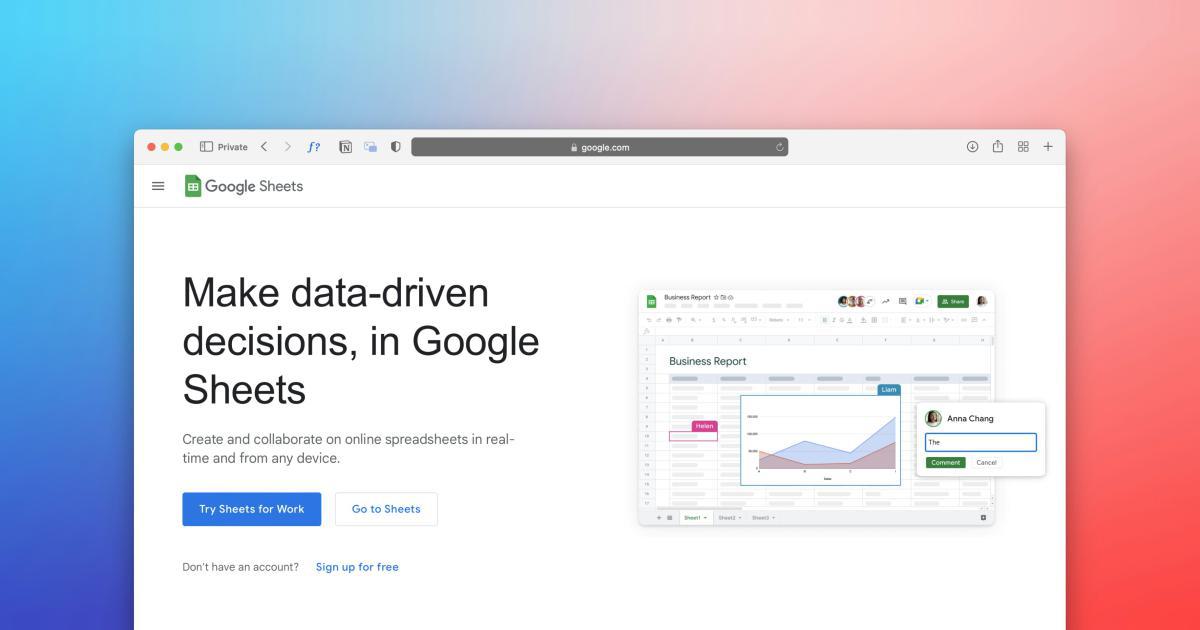
Many data visualization tools offer robust collaboration and sharing features, enabling users to easily share their visualizations with colleagues, stakeholders, or the broader public. These tools often provide options for embedding visualizations into presentations, reports, or websites, making it easier to disseminate insights.
Programming Languages
While programming languages can be used to create highly shareable visualizations, the process of collaborating and sharing may involve additional steps, such as exporting the visualizations as static images or embedding them in web pages. Some programming languages, however, do offer integration with cloud-based platforms and collaborative coding environments, which can facilitate the sharing and collaboration process.

Similarities
Both data visualization tools and programming languages share some similarities in their ability to effectively present data insights. Both approaches can be used to create visually appealing and informative graphics, and both can help users uncover patterns, trends, and relationships within their data.
Additionally, both data visualization tools and programming languages can be used to communicate complex information to a wide range of stakeholders, from executives to subject matter experts. The choice between the two approaches often comes down to the specific needs and preferences of the user, as well as the complexity and nature of the data being analyzed.
Differences
The primary difference between data visualization tools and programming languages lies in the level of control and customization they offer. Data visualization tools are generally more user-friendly and accessible, with a focus on simplifying the data analysis and visualization process. Programming languages, on the other hand, provide a higher degree of flexibility and customization, allowing users to create highly tailored visualizations and perform more advanced data manipulations.
Another key difference is the learning curve associated with each approach. Data visualization tools typically have a shorter learning curve, making them more accessible to users with limited programming experience. Programming languages, however, require a deeper understanding of coding concepts and syntax, which can be a barrier for some users.
Analysis
The choice between data visualization tools and programming languages ultimately depends on the specific needs and requirements of the user or organization. Both approaches offer unique strengths and weaknesses, and the optimal solution will depend on factors such as the complexity of the data, the level of customization required, the technical expertise of the user, and the intended audience for the visualizations.
For users who require a quick and user-friendly way to create visualizations, data visualization tools may be the better choice. These tools can be particularly beneficial for business professionals, marketers, and others who need to communicate insights to a non-technical audience. Data visualization tools can also be useful for exploratory data analysis, where users need to quickly identify patterns and trends within their data.
On the other hand, programming languages may be the preferred choice for users who require a higher degree of customization and analytical depth. Data scientists, researchers, and advanced analysts may find that programming languages offer more powerful data manipulation and analytical capabilities, allowing them to uncover deeper insights and create highly tailored visualizations.
It's important to note that the line between data visualization tools and programming languages is becoming increasingly blurred, with many tools offering integration with programming languages or even incorporating coding capabilities within their platforms. This convergence can provide users with a more seamless and comprehensive data analysis and visualization experience, allowing them to leverage the strengths of both approaches.
Conclusion
In the ever-evolving world of data analysis and visualization, both data visualization tools and programming languages play a crucial role in delivering insights and informing decision-making. While each approach has its own strengths and weaknesses, the choice between the two ultimately depends on the specific needs and requirements of the user or organization.
Data visualization tools offer a more user-friendly and accessible path to creating visually appealing graphics, making them well-suited for business professionals, marketers, and others who need to communicate insights to a non-technical audience. Programming languages, on the other hand, provide a higher degree of customization and analytical depth, making them invaluable for data scientists, researchers, and advanced analysts who require a more flexible and powerful approach to data manipulation and visualization.
As the demand for data-driven decision-making continues to grow, it is likely that we will see further convergence between data visualization tools and programming languages, with users leveraging the strengths of both approaches to unlock the full potential of their data. By understanding the unique capabilities and limitations of each approach, professionals can make informed choices about the tools and techniques that best suit their specific needs and deliver the most impactful insights.