Revitalize Content with Laser-Focused Click Distribution Metrics


Introduction
In the ever-evolving digital landscape, the success of content marketing hinges on a crucial factor: understanding your audience's engagement and behavior. As content creators, we're tasked with crafting compelling narratives that captivate and inspire our readers. However, the true measure of our impact lies in the way our content is consumed and shared.
Enter click distribution metrics, a powerful tool that can unlock the secrets to revitalizing your content strategy. By delving into the granular details of how your audience interacts with your content, you can uncover invaluable insights that will allow you to refine and optimize your approach, ultimately driving increased engagement and conversions.
In this comprehensive Q&A-style article, we'll explore the world of click distribution metrics, revealing how you can leverage this data to breathe new life into your content and captivate your target audience.
Q&A Sections
What are click distribution metrics, and why are they important for content marketing?
Click distribution metrics refer to the detailed analysis of how users engage with your content, including where they click, how they navigate through your website, and the patterns that emerge from their interactions.
These metrics are crucial for content marketing because they provide a window into the minds of your audience. By understanding how your readers consume and interact with your content, you can make informed decisions about what resonates with them, where they're struggling, and how to refine your approach to better meet their needs.
Analyzing click distribution metrics allows you to:
- Identify high-performing content that drives engagement and conversions
- Pinpoint areas of your content that may be underperforming or confusing to your audience
- Optimize the user experience by streamlining navigation and improving the flow of your content
- Personalize your content strategy to cater to the specific preferences and behaviors of your target audience
- Measure the impact of your content marketing efforts and make data-driven decisions to improve your overall performance

Key Takeaway
Click distribution metrics provide a detailed, data-driven understanding of how your audience interacts with your content, empowering you to make informed decisions that drive engagement and conversions.
What are the different types of click distribution metrics, and how can they be used to optimize content?
Some of the most valuable click distribution metrics for content optimization include:
Click-Through Rate (CTR): This metric measures the percentage of users who click on a specific link or call-to-action within your content. By analyzing CTR, you can identify the most engaging and compelling elements of your content, as well as areas that may need refinement.
Scroll Depth: Tracking how far users scroll through your content can reveal which sections are most captivating and which may be losing their attention. This information can guide you in restructuring your content to keep readers engaged.
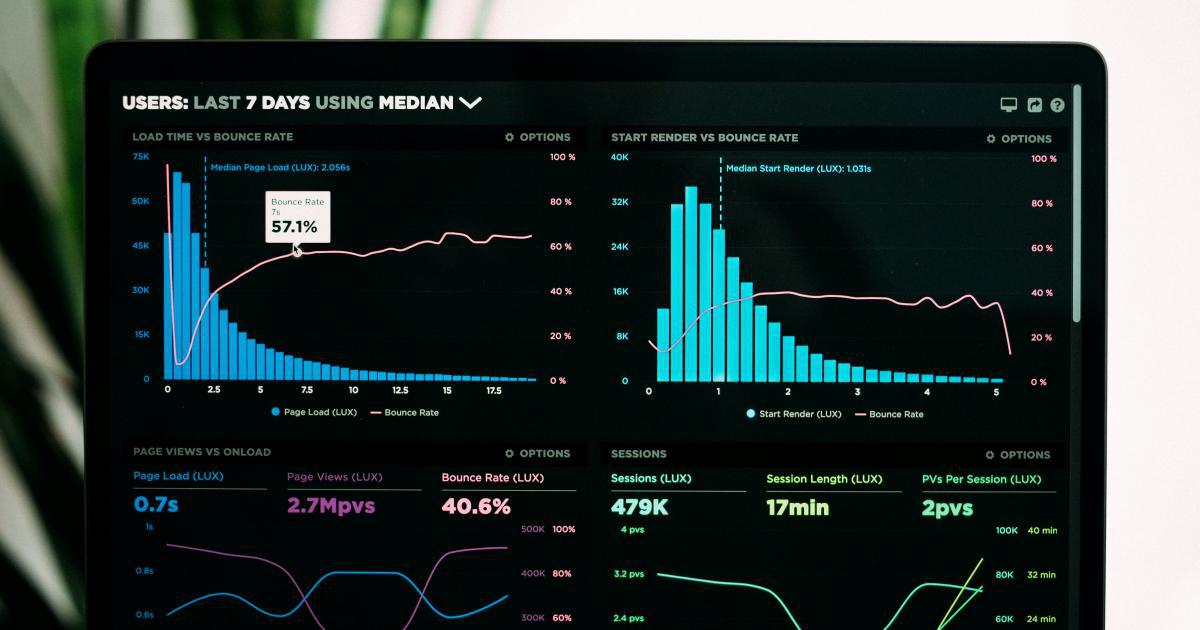
Bounce Rate: The bounce rate indicates the percentage of users who leave your website after viewing only one page. High bounce rates may suggest that your content is not resonating with your audience or that the user experience is suboptimal.
Time on Page: This metric measures the average time users spend on a particular page of your content. High dwell time can indicate that your content is valuable and engaging, while low time on page may signal a need for improvement.
Click Heatmaps: Heatmaps provide a visual representation of where users are clicking on your web pages, allowing you to identify high-traffic areas, as well as sections that may be overlooked or confusing.

By analyzing these click distribution metrics, you can make data-driven decisions to optimize your content in the following ways:
- Restructure your content to highlight the most engaging sections and improve the flow of information
- Refine your calls-to-action to increase click-through rates and drive conversions
- Identify and address areas of your content that are causing high bounce rates or low time on page
- Enhance the user experience by improving navigation and making your content more intuitive and accessible
Key Takeaway
Click distribution metrics, such as CTR, scroll depth, bounce rate, time on page, and click heatmaps, provide invaluable insights that can be used to optimize the structure, engagement, and user experience of your content.
How can you collect and analyze click distribution metrics to gain a deeper understanding of your audience?
Collecting and analyzing click distribution metrics requires the use of specialized tools and platforms. Some of the most popular options include:
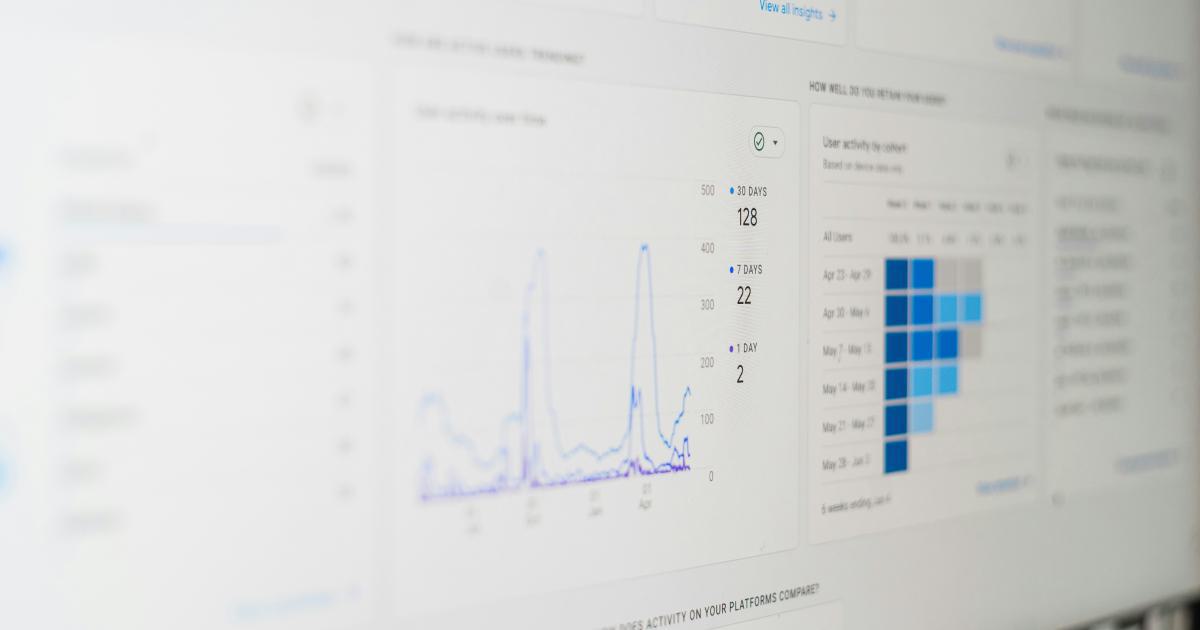
Google Analytics: This free and widely-used web analytics tool provides a wealth of data on user behavior, including click-through rates, scroll depth, bounce rates, and time on page. Google Analytics' intuitive dashboard and customizable reports make it a go-to choice for many content marketers.
Hotjar: Hotjar is a powerful user behavior and analytics platform that offers features like click heatmaps, scroll maps, and session recordings. These visual insights can provide a deeper understanding of how users interact with your content.
Crazy Egg: Crazy Egg is another popular tool for click tracking and heatmap analysis. It offers detailed reports on user interactions, allowing you to identify high-traffic areas, abandoned sections, and potential points of friction.
Microsoft Clarity: Microsoft Clarity is a free, user-friendly tool that provides click heatmaps, session recordings, and other user behavior analytics to help you understand how users engage with your content.
When analyzing click distribution metrics, it's essential to follow a structured approach:
Define your goals: Determine the specific objectives you want to achieve, such as improving engagement, reducing bounce rates, or increasing conversions.
Collect and organize your data: Leverage the tools mentioned above to gather relevant click distribution metrics and organize them in a way that allows for easy analysis.
Identify patterns and trends: Look for recurring patterns in user behavior, such as common click paths, areas of high or low engagement, and any outliers or anomalies.
Draw actionable insights: Based on the patterns and trends you've identified, formulate a plan to optimize your content and enhance the user experience.
Implement changes and measure the impact: Apply the necessary changes to your content and track the results using your click distribution metrics. Continually refine your approach based on the data.

Key Takeaway
Leveraging tools like Google Analytics, Hotjar, Crazy Egg, and Microsoft Clarity can provide a wealth of click distribution data to help you gain a deeper understanding of your audience and make informed decisions to optimize your content.
How can you use click distribution metrics to create a more personalized content experience for your audience?
Personalizing your content based on click distribution metrics can have a significant impact on user engagement and conversions. Here are some strategies to consider:
Segment your audience: Analyze your click distribution data to identify distinct user segments based on their behavior and preferences. This may include factors like content consumption patterns, device usage, or demographic information.
Tailor content recommendations: Use click data to recommend relevant content that aligns with each user's interests and browsing history. This can be done through personalized content blocks, sidebar recommendations, or AI-powered content suggestions.

Optimize content layout and structure: Analyze click heatmaps and scroll depth data to identify the most engaging sections of your content. Restructure your content to prioritize these high-performing areas and make them more prominent.
Personalize calls-to-action: Leverage click-through rate data to refine your calls-to-action, ensuring they resonate with your target audience and drive the desired actions.
Deliver personalized content variations: Create multiple versions of your content, each tailored to specific user segments based on their click behavior and preferences. This could involve variations in tone, format, or subject matter.
Optimize for device-specific experiences: Analyze click data across different devices (desktop, mobile, tablet) to identify any discrepancies in user behavior. Adjust your content and user experience accordingly to provide an optimal experience for each device.

By leveraging click distribution metrics to create a more personalized content experience, you can:
- Increase user engagement and time spent on your content
- Improve conversion rates and drive better business outcomes
- Enhance the overall user experience and build stronger connections with your audience
Key Takeaway
Personalization is key to delivering an exceptional content experience. By using click distribution metrics to segment your audience and tailor your content accordingly, you can create highly relevant and engaging experiences that resonate with your users.
How can you use click distribution metrics to identify and repurpose high-performing content?
Click distribution metrics can be a powerful tool for identifying your most engaging and successful content pieces, which can then be repurposed and amplified for maximum impact.
Analyze top-performing content: Review your click data to pinpoint the content assets that are generating the highest engagement, as measured by metrics like click-through rate, time on page, and low bounce rate.
Understand why certain content resonates: Dig deeper into the click distribution data to uncover what makes your top-performing content so compelling. Look for patterns in format, tone, topic, or other elements that contribute to its success.

Repurpose and expand on top content: Take your high-performing content and find ways to repurpose and expand upon it. This may involve creating video or audio versions, developing complementary content pieces, or transforming it into a more comprehensive resource.
Promote and distribute repurposed content: Leverage your click distribution data to determine the most effective channels and strategies for promoting your repurposed content. This may include social media, email marketing, or targeted advertising.
Continuously monitor and optimize: Regularly review the click distribution metrics for your repurposed content to gauge its performance and make any necessary adjustments to the format, messaging, or distribution approach.
By identifying and repurposing your high-performing content, you can:
- Maximize the return on investment of your content creation efforts
- Reach a wider audience and increase overall engagement
- Establish your brand as a trusted authority in your industry
- Drive more conversions and achieve better business outcomes
Key Takeaway
Leveraging click distribution metrics to identify and repurpose your top-performing content can be a highly effective strategy for amplifying your content's impact and driving continued success.
Conclusion
In the dynamic world of content marketing, click distribution metrics have emerged as a powerful tool for understanding and optimizing your audience's engagement. By delving into the granular details of how users interact with your content, you can unlock invaluable insights that will guide you in refining your approach, personalizing the user experience, and identifying high-performing content worthy of repurposing and amplification.
As you continue to harness the power of click distribution metrics, remember to remain adaptable and open to experimentation. The digital landscape is ever-evolving, and the strategies that work today may need to be adjusted tomorrow. By embracing a data-driven, audience-centric mindset, you'll be well-equipped to revitalize your content and captivate your target audience for years to come.